
Similar schools, different stories: will the new attendance expectations stay low stakes?
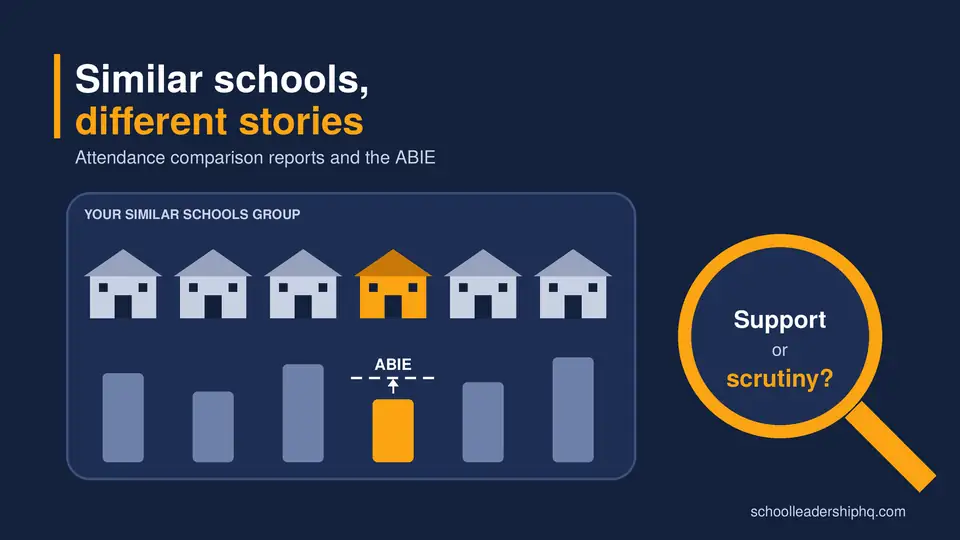
The DfE has updated its similar schools attendance reports and each school's Attendance Baseline Improvement Expectation. Comparing schools in context is better than relying on national averages, but only if it stays a tool for improvement. Recent history suggests that is a big if.
The DfE has refreshed its similar schools attendance reports and each school's Attendance Baseline Improvement Expectation. Comparing schools in context is better than relying on national averages, but only if it stays a tool for improvement. Recent history suggests that is a big if.
On 23 October, the Department for Education updated its guidance on attendance comparison reports for schools in England. Mainstream schools can now access updated similar schools comparison reports for 2025/26 through View your education data (VYED), and the reports carry each school's indicative Attendance Baseline Improvement Expectation (ABIE).
The DfE is clear in its guidance that the ABIE is not an accountability measure and will not be used for intervention. I want to take that at face value. I am just not sure the system around it will let it stay that way.
What has changed
The similar schools report compares a school's attendance with roughly 20 schools matched on demographics: the proportion of pupils eligible for free school meals, the proportion with SEND, IDACI scores, phase and size. It breaks attendance down by pupil group, names higher performing similar schools for overall attendance and persistent absence, and explains how to contact them.
The ABIE is described as the minimum expected improvement in overall attendance, tailored to the school's context. Schools received an indicative figure for 2025/26 to help them prepare, and the ABIE proper applies from 2026/27, set year by year. The minister's letter to governors and trustees makes clear that schools which consistently miss their ABIE, or miss it by some distance, will be signposted to further support, such as joining an Attendance and Behaviour Hub.
Reports are only produced for mainstream schools with enough data to make a reliable statistical match. Special schools and alternative provision do not receive them, and neither do very small schools (fewer than 20 pupils in Years 1 to 6 sharing data).
Comparison is imperfect, but better than the alternative
My first reaction to any "similar schools" model is caution. No two schools are truly alike. Free school meals eligibility, SEND percentages and deprivation indices are proxies, and they miss a great deal: pupil mobility, the proportion of pupils who join mid-year, local health patterns, housing pressures, the age of the building, the quality of local services and the story of a particular cohort. A school with high in-year mobility can look very similar on paper to a stable one, yet face a completely different attendance challenge. Small cohorts make the numbers volatile, so one family's difficult term can move a whole school's percentage.
Grouping schools also creates an implicit league table. However carefully the DfE frames it, a report that names the schools doing better than you invites ranking, and ranking invites judgement.
Even so, I think contextual comparison is better than the alternative. For years, the main yardstick has been the national average, which tells a school serving a highly disadvantaged community very little about what is realistically achievable for its pupils. Seeing how schools with genuinely comparable intakes are doing is more useful, more motivating and, in principle, fairer. The opportunity to contact a similar school that has cracked persistent absence for disadvantaged pupils is the most valuable thing in the report. That is collaboration, not competition.
So my position is simple: compare, by all means, as long as the comparison is used to support improvement and not to hold schools to account.
Why I doubt it will stay that way
The difficulty is that we have been here before. Data that starts life as a diagnostic tool has a habit of becoming a performance measure once it exists, is easy to read and sits next to a number labelled "expectation". Progress measures, internal tracking data and "aspirational" targets have all followed that path, and school leaders have learned to treat the phrase "not an accountability measure" with some care.
The current inspection framework makes that drift more likely, not less. Attendance now sits within Ofsted's combined attendance and behaviour evaluation area, graded on a scale from urgent improvement to exceptional and judged on a secure fit basis. Schools Week analysis of Ofsted data found that almost a quarter of the most deprived schools fell below the expected standard for attendance and behaviour, compared with 5 per cent of the least deprived.
Ofsted's response has been to add a "similar schools" measure to the information inspectors review, developed jointly with the DfE and due to be available to inspectors from September. That is welcome in one sense, because it acknowledges context. But it also means comparative attendance data is now part of the evidence base for a graded inspection judgement. Once inspectors can see how a school compares with its similar schools group, it is hard to imagine a conversation about attendance that does not touch on whether the school is meeting the improvement the DfE expects of it.
Add in the signposting of schools that miss their ABIE, the involvement of local authority and regional teams, and governors being encouraged to ask for their school's ABIE, and the line between "support" and "scrutiny" starts to look thin. The ABIE itself may never appear in an inspection report. It does not need to. The data behind it will shape the questions, the narrative and the pressure.
I would be delighted to be proved wrong. But given past experience and the stakes attached to the current framework, I think heads should plan on the assumption that this data will be used to judge them, while continuing to use it for what it is genuinely good for.
What I would do now
- Download and read the report properly. Log in to VYED, open "Monitor your school attendance" and download your similar schools comparison report. Check which schools you are matched with and whether the match feels credible.
- Know your own context better than the model does. Be ready to explain the factors the statistical match does not capture, such as mobility, mid-year admissions, cohort size or local health issues, with evidence rather than anecdote.
- Look at persistent absence and pupil groups, not just the headline. The headline percentage hides most of the story. The breakdowns for disadvantaged pupils and pupils with SEND are where the useful insight usually sits.
- Use the named schools. The most valuable part of the report is the list of similar schools doing well. A phone call or a visit is likely to teach you more than the data itself.
- Brief governors carefully. Governors are being encouraged to ask about the ABIE. Make sure they understand both what it is for and what it does not capture, so it informs challenge rather than becoming a target in its own right.
- Check your data sharing. Reports depend on accurate daily attendance data, complete pupil characteristics and standard attendance codes. If your report is missing or looks wrong, the DfE guidance explains the most common causes.
- Keep the focus on pupils, not the percentage. The risk of any expectation is that it nudges schools towards managing the number. The schools that improve attendance sustainably tend to be the ones that focus on relationships, early help and removing barriers for individual children.
Resources
Get more like this
One practical idea, one resource, one piece of tech, weekly.